ThinkMarkets Asia Live
差價合約交易
加密貨幣
比特幣與乙太幣
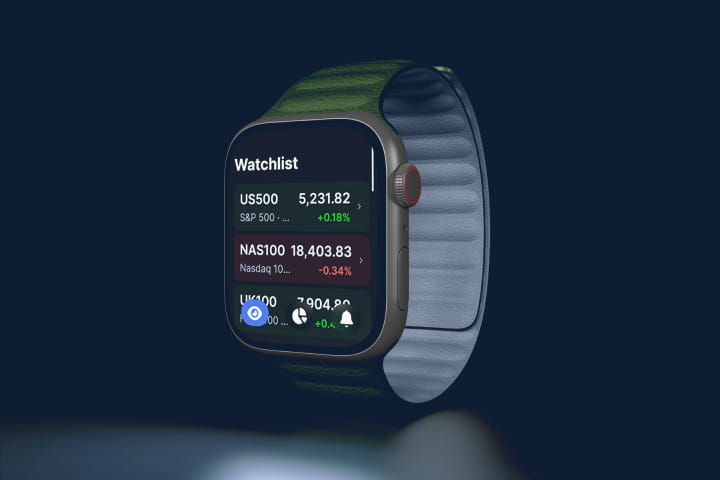
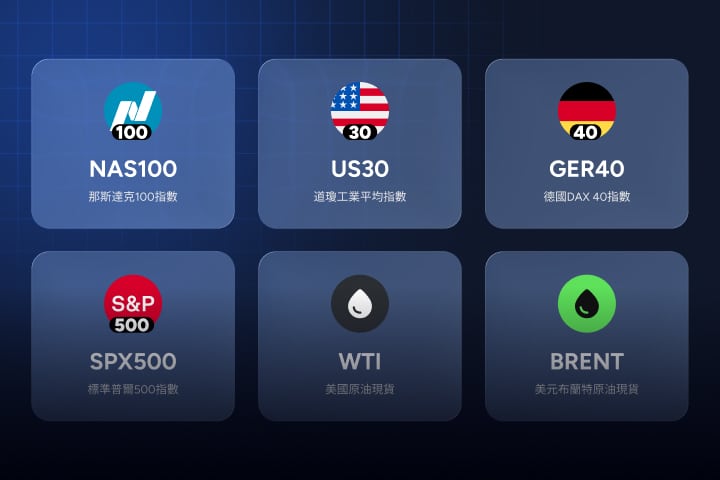
指數
21個全球指數
原油
紐約輕原油與布蘭特原油
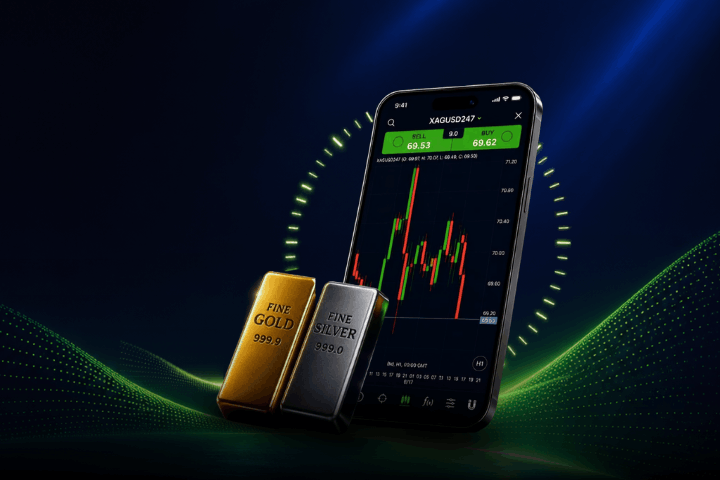
貴金屬
黃金、白銀與鉑金
股票
美股與港股
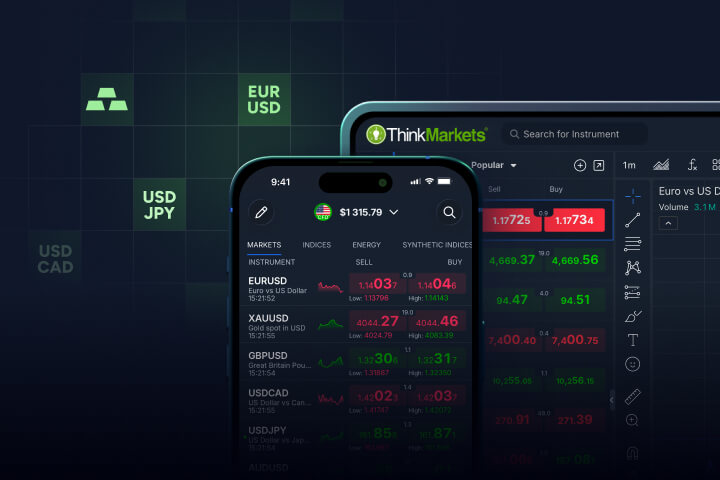
外匯
超過40個貨幣對
ETFs
交易型開放式基金
合成指數
交易型合成指數
合約規格
合約詳情
交易商品合約详情
動態槓桿
最高2000倍槓桿
ThinkTrader平台
平台總覽
交易4000+全球資產
網頁平台
直接於網頁中交易
行動交易
隨時隨地交易
TradingView平台
串連TradingView交易
Traders’ Gym
獨家復盤回測工具
MetaTrader平台
MetaTrader4
熱門的MT4平台
MetaTrader5
最新的MT5平台
帳戶類型比較
比較不同帳戶類型
交易學院
學院總覽
系統化課程
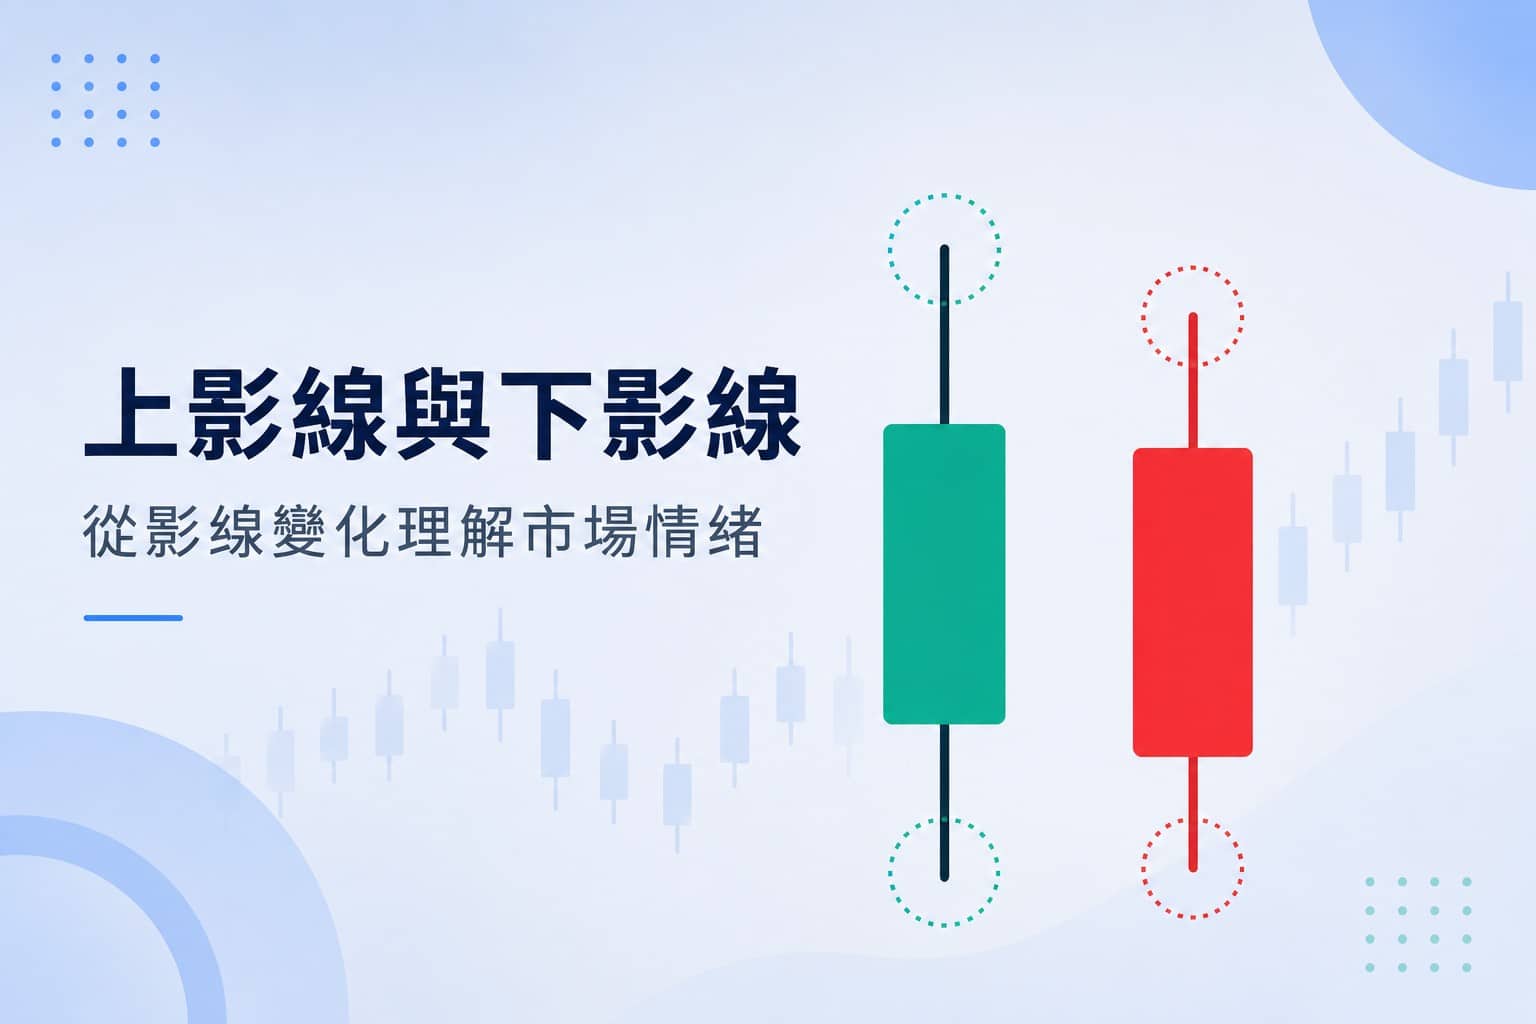
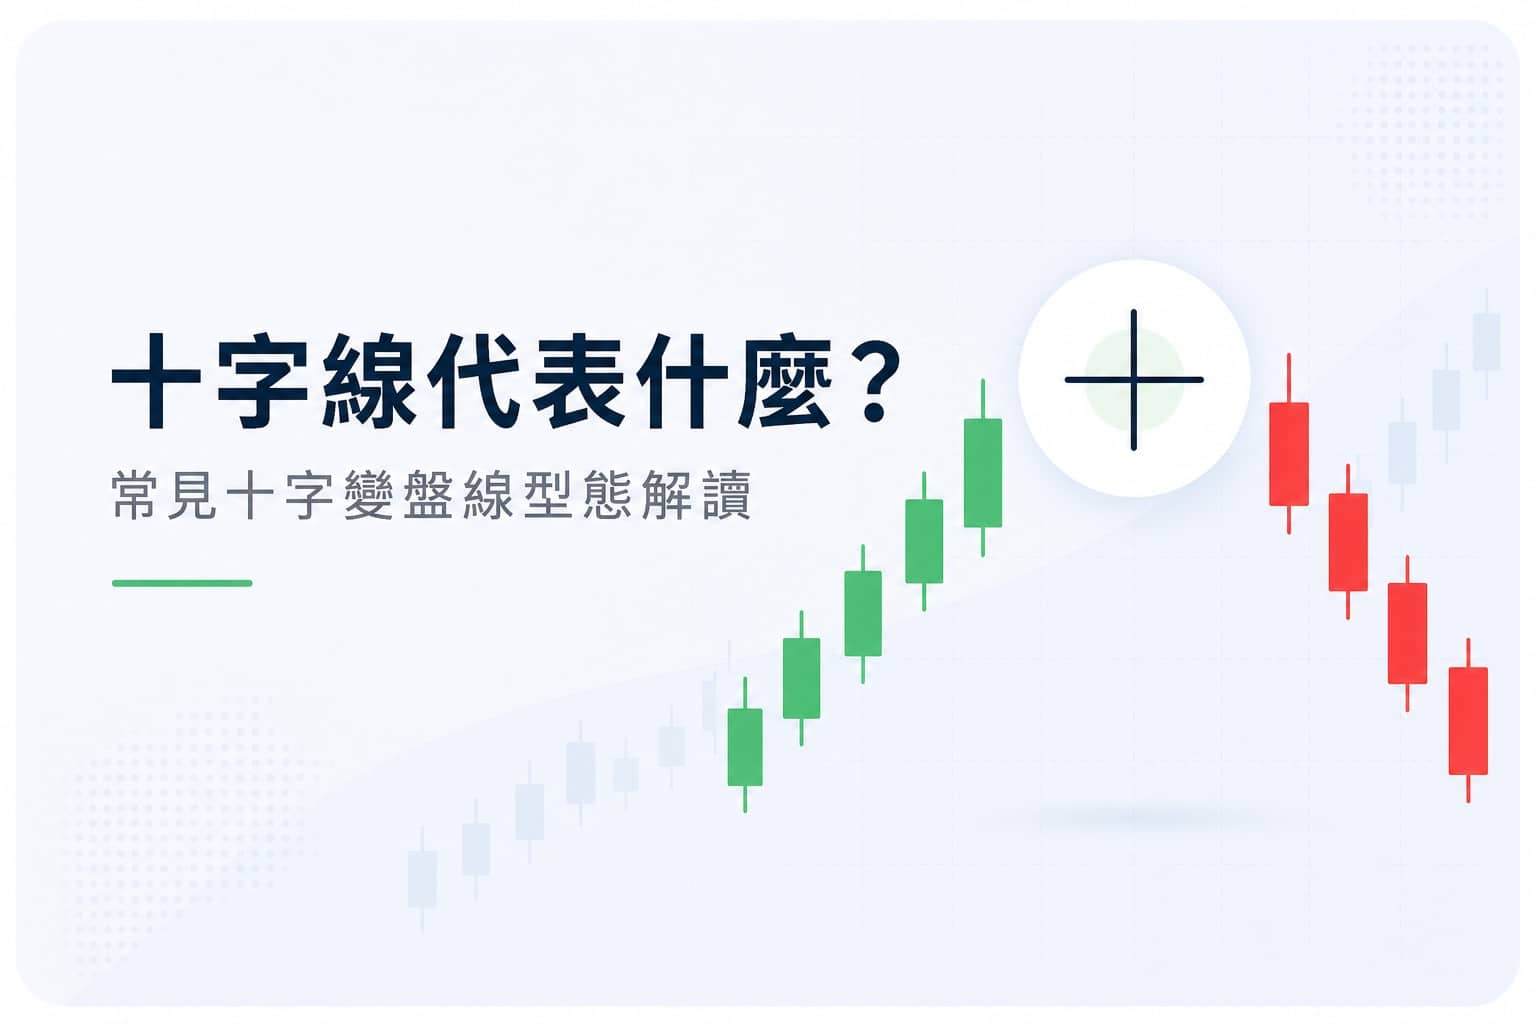
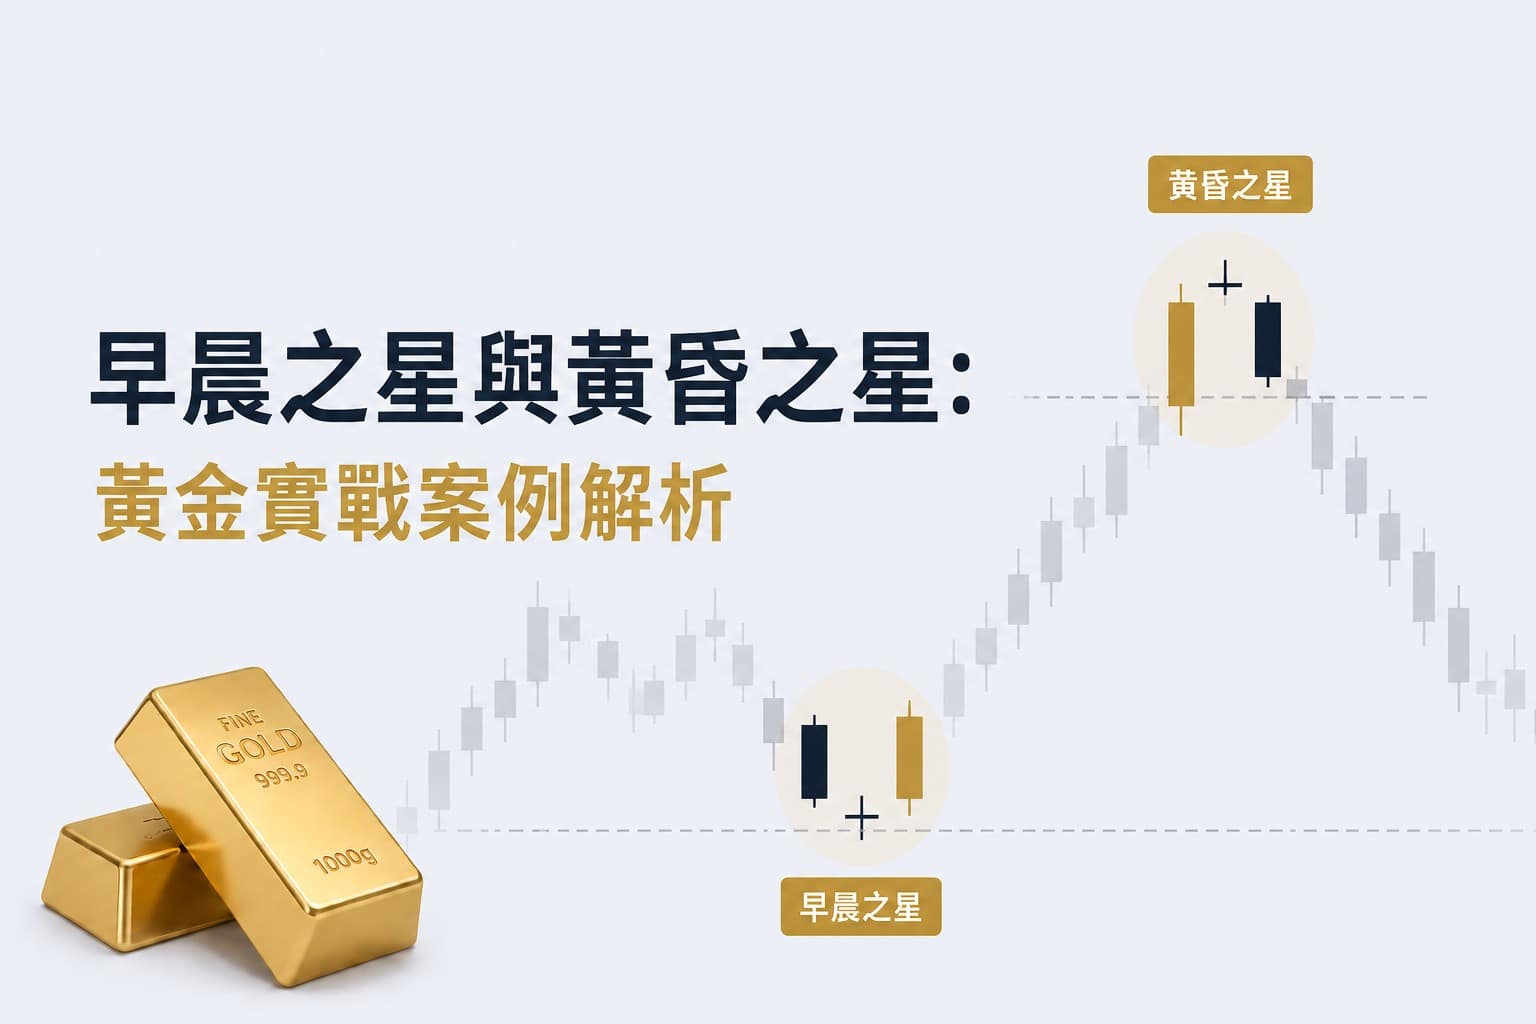
技術分析
K線、指標與圖表型態
基本面分析
利率、通膨等基礎經濟學
市場知識
深入不同金融市場
交易术语
專業金融交易術語
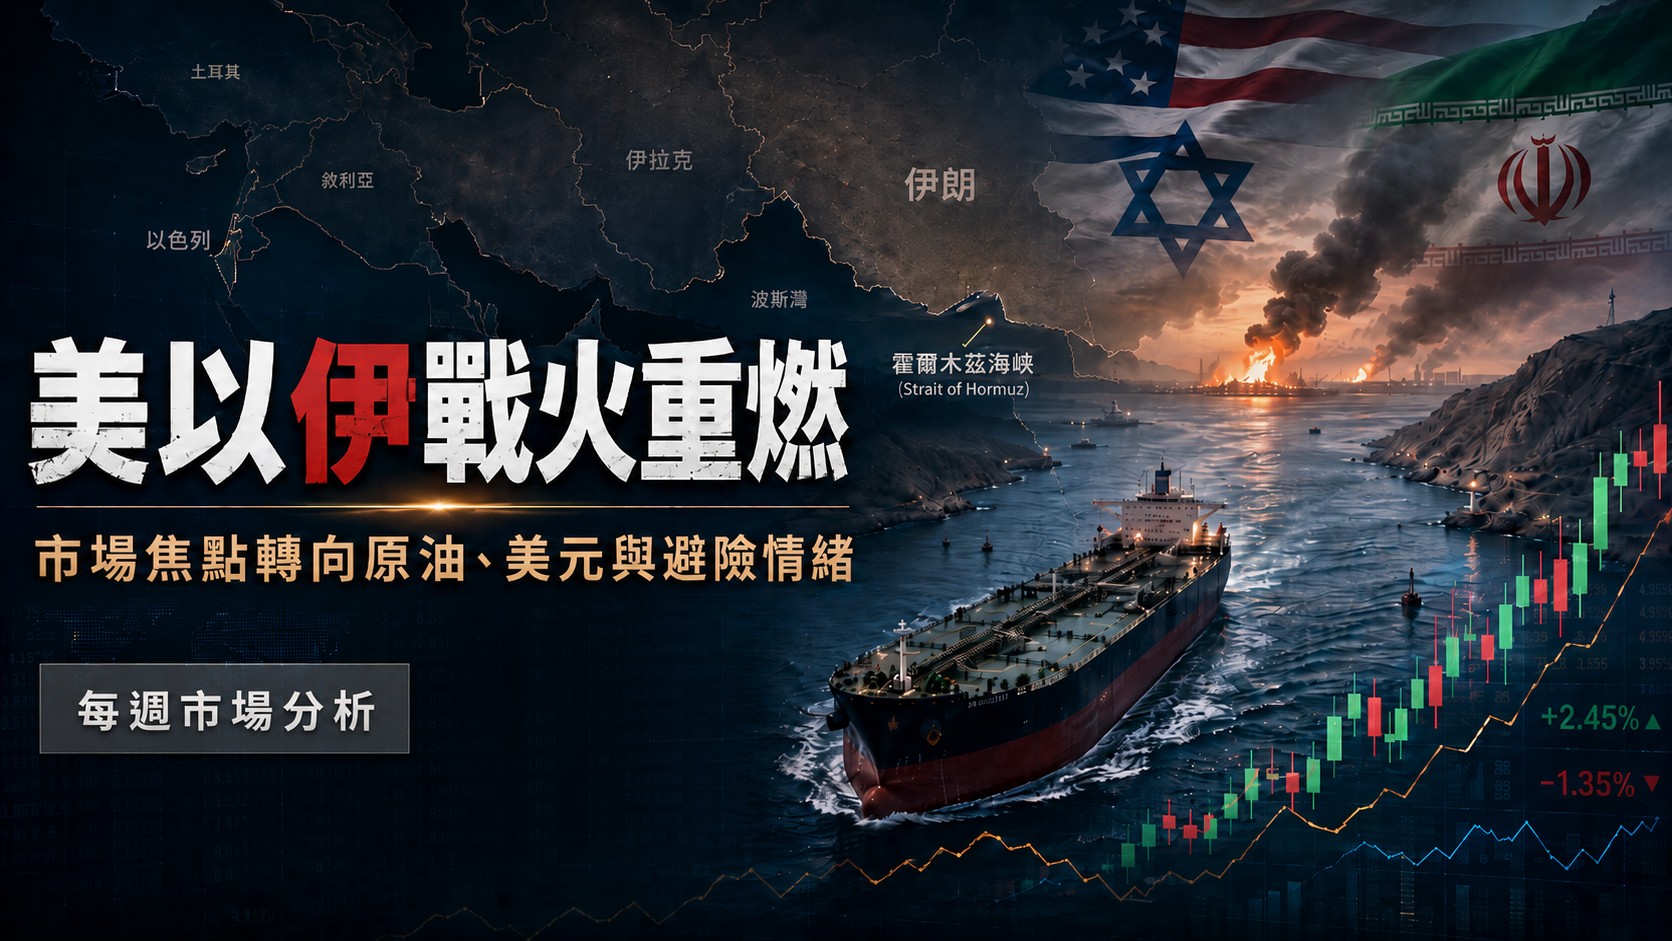
市場新聞
市場分析
專家見解
財經日曆
財經指標與事件
關於ThinkMarkets智匯
關於ThinkMarkets
公司與監管資訊
新聞公告
公司新聞公告
市場
交易平臺
學習
關於我們
語言
選擇您的等級
精選最受讀者喜愛的頂尖文章,掌握您不可錯過的重要洞見。
產品
學院
分析
找不到匹配結果。試試其他内容?
請檢查拼字或嘗試不同的關鍵字。
找不到匹配的结果。试试其他内容?